Activism via Machine Learning: Modified Hidden Markov Model to forecast protest activities
Have you heard about Greta Thunberg? That ‘…very happy young girl looking forward to a bright and wonderful future’. She is all over the news and my twitter feed recently. Most of those in my digital circle post a lot of her gifs as she voice out her advocacies on the main stage of international climate summits. A lot seems to be attracted by her sense of purpose and ‘woke-ness’ at a young age.

There seems to be a lot of online clamor showing support for her activism. We tend to be drawn to hero figures like her and the extra-ordinariness of her cause. But sometimes, actions need not to be very extra-ordinary to be heroic.
Let me ask you if you yourself have met an activist like her? It seems unlikely when you live in the Philippines.
I myself is an activist like Greta. I may not be as young as her but I am just as pretty :). To be honest, I think being an activist in the Philippines (regardless of advocacy e.g. environment, basic social services, human rights, etc.) is much harder and dangerous. If you declare yourself as an activist and go out into the open, often than not you will be tagged as a member of the New Peoples Army, a communist, or even a radical terrorist. Being an activist in the Philippines means acceptance of the perils and circumstances that comes with it.
If you are active on Facebook, chance is high that you might have encountered news about atrocities against activists (mainstream media don’t usually report it). Just recently, news broke about forest rangers and protectors in Palawan being killed by paramilitary men and illegal loggers. I think hard about this. How can we tell the future generations to love and protect nature when people who do that suffer and are killed?
As for my case, I have accepted these consequences and stay firm with my principles and advocacies to make a difference. When I was a student activist in University, my advocacy is on accessibility to education and ultimately pushing for free education for all. I believe that education is a right and not a privilege. I joined various demonstrations and rallies to forward and lobby this. As a science major, I always integrate my math skills to calculate the feasibility figures of free education and put it creatively in our rally boards and chants. The streets became my laboratory and the struggles of poor students became my thesis.
Eventually, through the pressure of decade long big rallies (see image below) and actual lobbying in congress (yes), in August 2017 The Universal Access to Quality Tertiary Education Act, or Republic Act 10931 was signed into law. Now, students from various walks of life can enjoy free education in all state colleges and universities in the country.

Education is only one part of the various struggles that Filipino citizens face on a daily basis spanning from the lack of basic social services, government unaccountability and state neglect, irresponsible mining, and the notorious extrajudicial killings in the face of tokhang. These struggles happen across the archipelago and experienced by various sectors of our society.
In my years as a student activist, I learned that to build democracy, we need to put it in our collective hands. There are lessons in history that we should never forget like how we did it in People Power 1 and People Power 2 against the dictator Marcos and jueteng-lord Estrada. We can also learn lessons from recent collective actions of our neighbors in Hong Kong against extradition and in student rallies in Indonesia against proposed new laws on criminalization if extramarital sex and in insulting their president’s honor.
Nowadays, much of our time are spent online, thus emerges a new type of activists. They are often called as keyboard activists. They are the ones who initiate twitter rallies and share ‘woke memes’. Maybe you yourself have shared or retweeted their content.

For this particular project, what I am interested is when do these activists flood the streets? When will their digital words turn into real-life actions?
Data Wrangling
To do that I need a lot of data. Luckily, the GDELT project provides more than enough.
Global Database of Events, Language, and Tone (GDELT), created by Kalev Leetaru of Yahoo! and Georgetown University, along with Philip Schrodt and others, describes itself as "an initiative to construct a catalog of human societal-scale behavior and beliefs across all countries of the world, connecting every person, organization, location, count, theme, news source, and event across the planet into a single massive network that captures what's happening around the world, what its context is and who's involved, and how the world is feeling about it, every single day." [2].
The GDELT Project is a real time network diagram and database of global human society for open research [3]. It monitors print, broadcast, and web news media in over 100 languages from across every country in the world to keep continually updated on breaking developments anywhere on the planet. Its historical archives stretch back to January 1, 1979 and update every 15 minutes. Through its ability to leverage the world’s collective news media, GDELT moves beyond the focus of the Western media towards a far more global perspective on what’s happening and how the world is feeling about it.
I used Google’s Big Query to get the event logs of all news in the Philippines since year 2000 (here is the script I used):
These are the steps that I followed:
1. Ground Set Extraction
2. Burstiness Modelling
3. Hidden Markov Modelling
4. Naive Bayes Decision
Each record in GDELT has 61 fields, pertaining to a specific event in CAMEO format.
Conflict and Mediation Event Observations (CAMEO) is a framework for coding event data (typically used for events that merit news coverage, and generally applied to the study of political news and violence). [4]
For my daily aggregation, I only need and obtained these fields:
SQLDATE, MonthYear, EventRootCode, GoldsteinScale, NumMentions, AvgTone, ActionGeo_CountryCode, ActionGeo_Lat, ActionGeo_Long
Note:
GoldsteinScale is a numerical score ranging from -10 to 10 which signifies the theoretical potential impact that type of event will have on the stability of the country. NumMentions is the total number of mentions of this event across all source documents, which can be used as a method of assessing the importance of an event: the more the discussion of the event is, the more likely it is to be significant. AvgTone is the average tone of all documents containing one or more mentions of this event ranging from -100 (extremely negative) to 100 (extremely positive) [5]. Action_Geo_Country code is the location of the event, ActionGeo_Lat and ActionGeo_Long are the centroid latitude and longitude of the landmark which I used to plot the Philippine map gif above.
Ground Set Extraction
The events in GDELT are categorized by identified themes labeled 1 to 20. The theme includes verbs describing the type of action of an event like reject (12), protest (14), threaten (13), coerce (17), assault (18), etc.
To get the ground truth, event root code number 14 signifies events with mentions of PROTEST. I filtered out only those who have significant number of mentions across the years. I started with 2000 and aggregated on a daily basis. Plotting the time series,

we see that there is a heterogeneous upward trend in the event mentions [5]. To remove this, I have implemented a 90 day moving average to normalize the signal using this equation:

To set the baseline value of number of significant event values, we define that the average mention count on each day is given by

and to smoothen out the data, we use a seven day moving average:

where \(\theta\) is the upper bound of the 95% confidence interval of the time series. It’s a lot of math, I know (same girl I can relate, also took me a while to understand this) but we aren’t yet discussing the model which is more intense (and fun!).
Upon normalization, here is the result:

All of the points above the red line are days with significant rallies.
I used these points as labels and reduce my problem to a supervised binary classification. Those days with significant count of rally mentions are labeled as 1 while those with none are tagged as 0.
I will discuss the details of the coupled Burstiness and Hidden Markov Model (HMM) that I implemented in another blog post. I chose HMM because it accounts for time series variation as sequence learning and coupled it with Burstiness Modelling to properly account for the probabilities and duration of events (also called as states).
Research in social movements point out there are mini-events that lead to the occurrence of a big rally. In this study, I hypothesize that this event progression is given by this ladder:
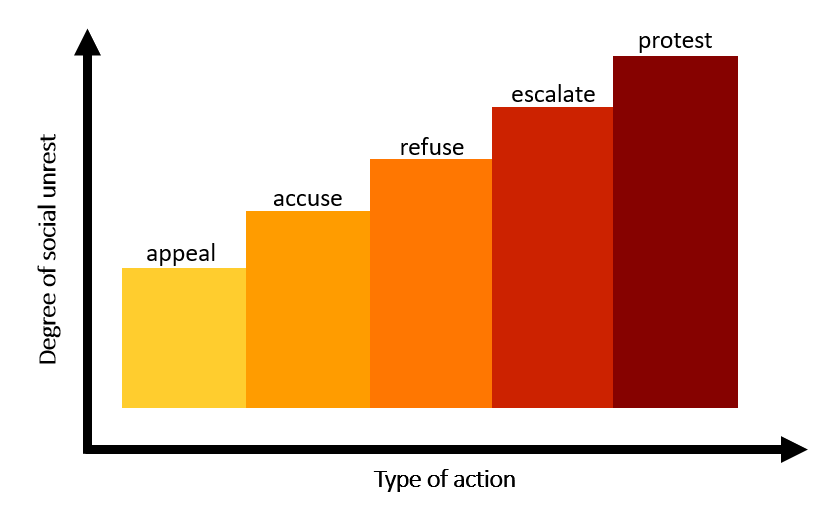
These five so-called states (identified in GDLET as event root codes 10, 11, 12, 13, and 14) are what I used to define the observation vector needed by the HMM. To increase accuracy of prediction, I also added the AvgTone and GoldsteinScale (discussed above) to the dimension of the observation. Thus, the final vector is given by:

HMM is a strong candidate for this problem because it can approximate the likelihood of an event occurring given the probabilities of the progression of the states. This statement can be visualized by this diagram:
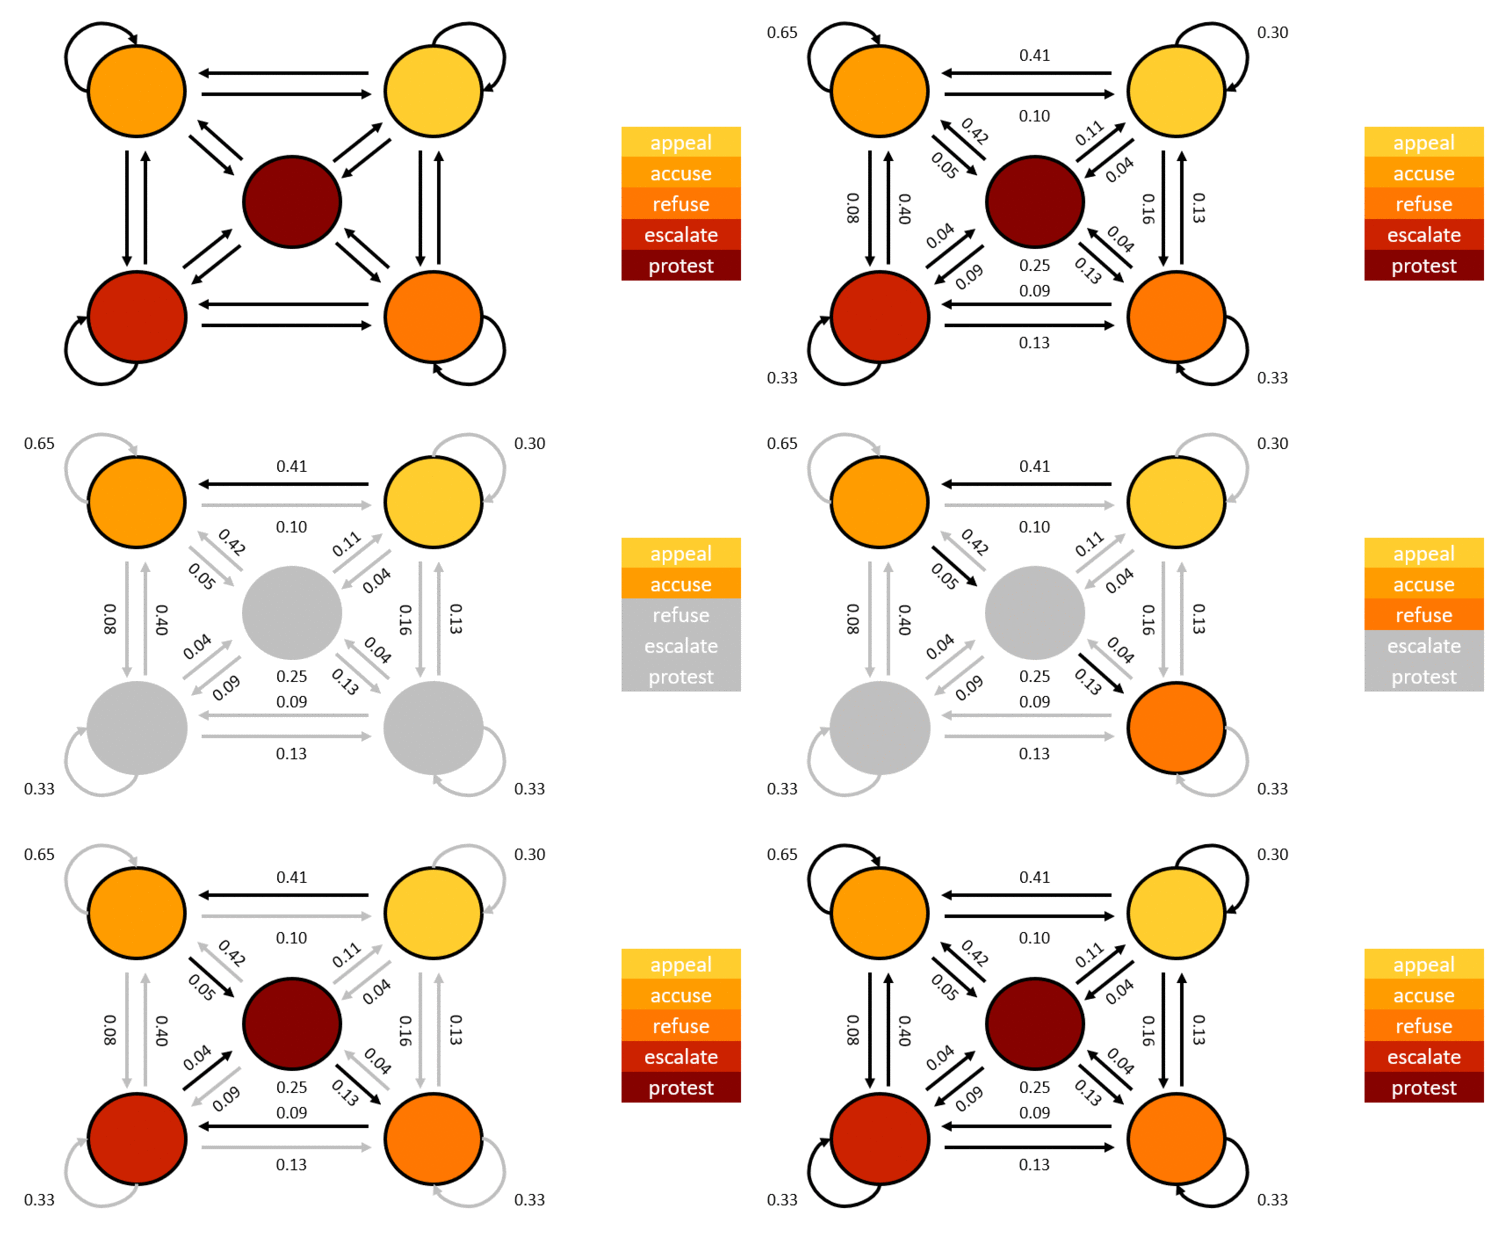
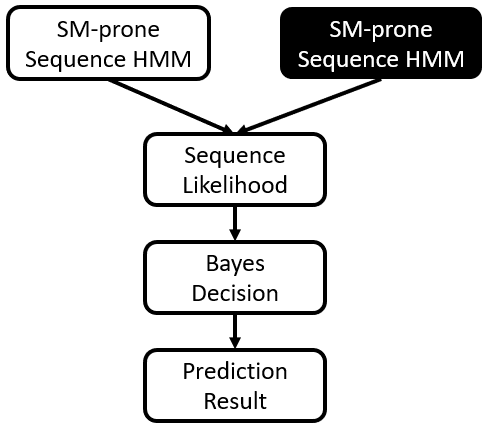
The numbers in the diagram indicates probabilities when a particular state will transition to another state. HMM is used to estimate the parameters for the model. To increase the accuracy of the solution, I trained two models. One is trained to classify if a date range contains a rally (SM-prone) and the other model is trained to identity non-rally days (SM-free) as exemplified by this diagram:

I used 2000-2015 as my training set and 2016-2019 as my test set. I implemented a Bayes log likelihood decision mechanism to decide which model is more accurate in a given date prediction range.
For baseline model comparison, since I reduced the problem into a supervised binary classification, I used Logistic Regression. It is commonly used in a lot of machine learning methods in the event prediction and forecasting literature. For each day, I summed over all event mentions with event root code 14 and use it as an indicator of big rallies.
Results
The ROC curve of the model compared to the Logistic Regression baseline is shown below:
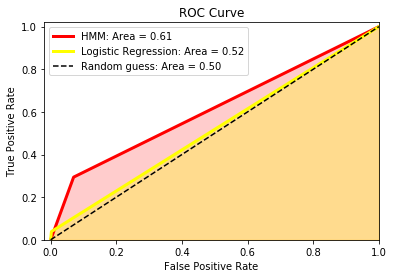
Here are the accuracies and precisions:

As we can see, the modified Hidden Markov Model performed better than Logistic Regression. Using a time window of seven days means that this particular model implementation will be able to predict if a big rally will happen within the next 7 days.
Conclusion
The results can be useful depending on your biases. If you are an activist like me who organize people to rally for certain causes and advocacies, you would know if there is enough online clamor before a rally occur and encourage more discussions to meet a certain threshold value.
If you are a member of the reactionary state force, you will most likely use this prediction to suppress social movements in favor of the status quo.
If you are a normal citizen, you decide whether the issues being talked about speak relevance and weigh in future consequences.
Recommendations
Current research point out that social embeddedness, emotions, grievance and identity [6] are the most important features that influence protest activities. This can be verified using NLP and feature importance from the news data set used above and can be done as an extension of this project.
Takeaways
My bias is that I am an activist. I believe that activism is a way of life. And everyone of us are all activists in our own little ways. Sometimes we just need to be reminded why we do the things we do and ultimately ask for whom do we do these things.
For my case, I will continue to join rallies and stick to my principles as I believe that only through collective action can we truly achieve genuine social change. As for the corrupt politicians in the Philippines,
See you in the future and hopefully in future rallies and protest actions. #BeLikeGreta #DataScienceForThePeople
Credits
I want to acknowledge Esklwelabs in pursuit of this project. Also shout out to Data Science Fellow Cohort II. You are the best data science study buddies! I know you guys will be actuators in your future endeavors. Sending lots of love and virtual hugs :)
Want to collaborate? Message me in LinkedIn.
References
[1] Gfycal. Donald Trump and Greta Thunberg 1. Retrieved from : https://gfycat.com/fancycoarsekrill-donald-trump
[2] Wikipedia. Global Database of Events, Language, and Tone. Retrieved from: https://en.wikipedia.org/wiki/Global_Database_of_Events,_Language,_and_Tone
[3] The GDLET Project. Retrieved from: https://www.gdeltproject.org/
[4] Wikipedia. Conflict and Mediation Event Observations. Retrieved from: https://en.wikipedia.org/wiki/Conflict_and_Mediation_Event_Observations
[5] Discrete Dynamics in Nature and Society. Predicting Social Unrest Events with Hidden Markov Models Using GDELT. Retrieved from: https://www.hindawi.com/journals/ddns/2017/8180272/
[6] EPJ Data Science. Activism via attention: interpretable spatiotemporal learning to forecast protest activities. Retrieved from: https://epjdatascience.springeropen.com/articles/10.1140/epjds/s13688-019-0183-y
[7] Gfycal. Donald Trump and Greta Thunberg 2. Retrieved from : https://tenor.com/view/well-be-watching-you-greta-thunberg-gif-15167876


